Docker 部署 Prometheus的安裝詳細教程
Docker 部署 Prometheus 說明:
監控端安裝:Prometheus Server(普羅米修斯監控主服務器 )Node Exporter (收集Host硬件和操作系統信息)cAdvisor (負責收集Host上運行的容器信息)Grafana (展示普羅米修斯監控界面)
被監控安裝:Node Exporter (收集Host硬件和操作系統信息)cAdvisor (負責收集Host上運行的容器信息)
1.安裝Node Exporter 所有服務器安裝 Node Exporter 收集系統信息,用于監控CPU、內存、磁盤使用率、磁盤讀寫等系統信息 –net=host,這樣 Prometheus Server 可以直接與 Node Exporter 通信docker run -d -p 9100:9100 -v '/proc:/host/proc' -v '/sys:/host/sys' -v '/:/rootfs' -v '/etc/localtime:/etc/localtime' --net=host prom/node-exporter --path.procfs /host/proc --path.sysfs /host/sys --collector.filesystem.ignored-mount-points '^/(sys|proc|dev|host|etc)($|/)'[root@k8s-m1 ~]# docker ps|grep exporteree30add8d207 prom/node-exporter '/bin/node_exporter …' About a minute ago Up About a minute condescending_shirley2.安裝cAdvisor 所有服務器安裝 cAdvisor 收集docker信息,用于展示docker的cpu、內存、上傳下載等信息 –net=host,這樣 Prometheus Server 可以直接與 cAdvisor 通信
docker run -d -v '/etc/localtime:/etc/localtime' --volume=/:/rootfs:ro --volume=/var/run:/var/run:rw --volume=/sys:/sys:ro --volume=/var/lib/docker/:/var/lib/docker:ro --volume=/dev/disk/:/dev/disk:ro --publish=18104:8080 --detach=true --name=cadvisor --privileged=true google/cadvisor:latest[root@k8s-m1 ~]# docker ps|grep cadvisorcf6af6118055google/cadvisor:latest '/usr/bin/cadvisor -…' 38 seconds ago Up 37 seconds 0.0.0.0:18104->8080/tcp cadvisor
可以進入容器查看:[root@agent ~]# sudo docker exec -it 容器id /bin/sh3.安裝 Prometheus Server
監控端安裝
1)編輯配置文件
首先在本地創建 prometheus.yml 這是普羅米修斯的配置文件 將下方內容寫入到文件中 將監聽的地址改為自己本機地址# my global configglobal: scrape_interval: 15s # Set the scrape interval to every 15 seconds. Default is every 1 minute. evaluation_interval: 15s # Evaluate rules every 15 seconds. The default is every 1 minute. # scrape_timeout is set to the global default (10s).# Alertmanager configurationalerting: alertmanagers: - static_configs: - targets: # - alertmanager:9093# Load rules once and periodically evaluate them according to the global ’evaluation_interval’.rule_files: # - 'first_rules.yml' # - 'second_rules.yml'# A scrape configuration containing exactly one endpoint to scrape:# Here it’s Prometheus itself.scrape_configs: # The job name is added as a label `job=<job_name>` to any timeseries scraped from this config. - job_name: ’prometheus’ # metrics_path defaults to ’/metrics’ # scheme defaults to ’http’. static_configs: #監聽的地址 - targets: [’localhost:9090’,’172.23.0.241:8088’,’172.23.0.241:9090’]
2)啟動容器
1> prometheus.yml配置文件
prometheus.yml內需配置外網ip,內網ip除了本機,在grafana識別不到!
# my global configlobal: scrape_interval: 15s # Set the scrape interval to every 15 seconds. Default is every 1 minute. evaluation_interval: 15s # Evaluate rules every 15 seconds. The default is every 1 minute. # scrape_timeout is set to the global default (10s).# Alertmanager configurationalerting: alertmanagers: - static_configs: - targets: # - alertmanager:9093# Load rules once and periodically evaluate them according to the global ’evaluation_interval’.rule_files: # - 'first_rules.yml' # - 'second_rules.yml'# A scrape configuration containing exactly one endpoint to scrape:# Here it’s Prometheus itself.scrape_configs: # The job name is added as a label `job=<job_name>` to any timeseries scraped from this config. - job_name: ’prometheus’ # metrics_path defaults to ’/metrics’ # scheme defaults to ’http’. static_configs: #監聽的地址(此處為服務器內網ip) - targets: [’10.27.158.33:9090’,’10.27.158.33:9100’,’10.27.158.33:18104’] - targets: [’10.29.46.54:9100’,’10.29.46.54:18104’] - targets: [’10.27.163.172:9100’,’10.27.163.172:18104’]# - job_name: ’GitLab’# metrics_path: ’/-/metrics’# static_configs:# - targets: [’172.23.0.241:10101’] - job_name: ’jenkins’ metrics_path: ’/prometheus/’ scheme: http bearer_token: bearer_token static_configs: - targets: [’172.23.0.242:8080’] - job_name: 'Nginx' metrics_path: ’/status/format/prometheus’ static_configs: - targets: [’172.23.0.242:8088’]
2>啟動命令
–net=host,這樣 Prometheus Server 可以直接與 Exporter 和 Grafana 通
docker run -d -p 9090:9090 -v /root/Prometheus/prometheus.yml:/etc/prometheus/prometheus.yml -v '/etc/localtime:/etc/localtime' --name prometheus --net=host prom/prometheus:latest# 當Prometheus容器啟動成功后訪問# PS:服務器需開啟eth0的外網端口,才可用瀏覽器訪問 9090 0.0.0.0106.15.0.11:90904.創建運行Grafana 監控服務器安裝 用于圖像化顯示
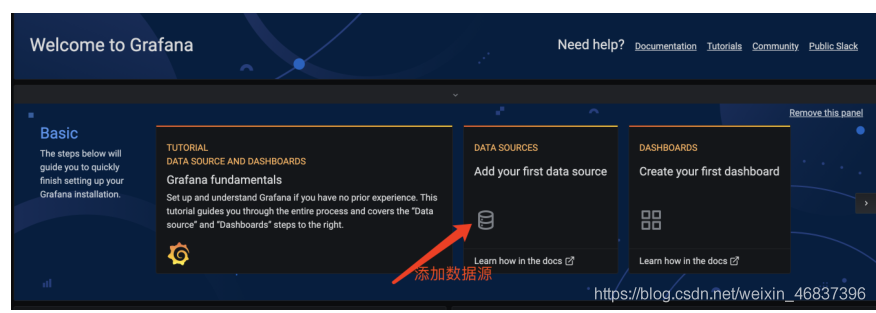
docker run -d -i -p 3000:3000 -v '/etc/localtime:/etc/localtime' -e 'GF_SERVER_ROOT_URL=http://grafana.server.name' -e 'GF_SECURITY_ADMIN_PASSWORD=admin8888' --net=host grafana/grafana# PS:服務器需開啟eth0的外網端口,才可用瀏覽器訪問:3000 0.0.0.0Grafana啟動后,在瀏覽器中打開 172.23.0.241:3000 登錄界面,登錄:用戶名:admin密碼:admin8888
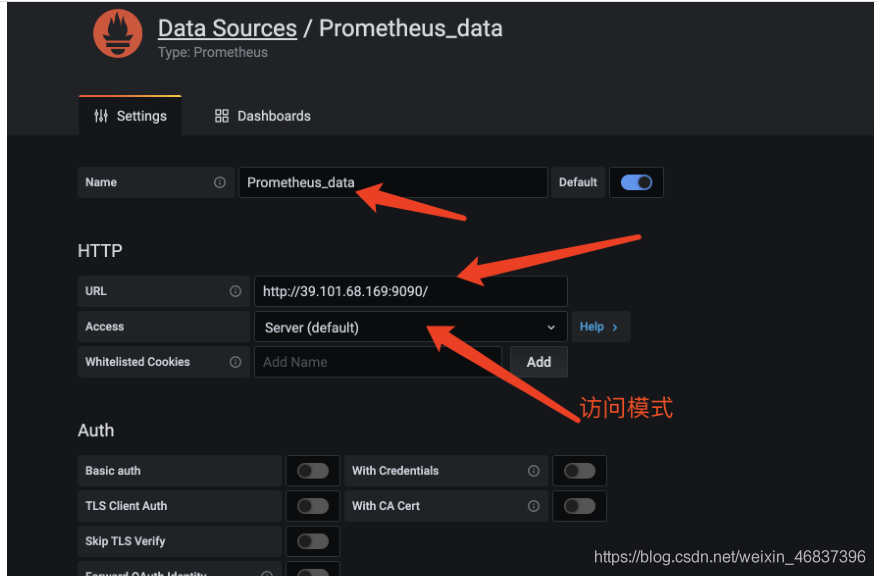
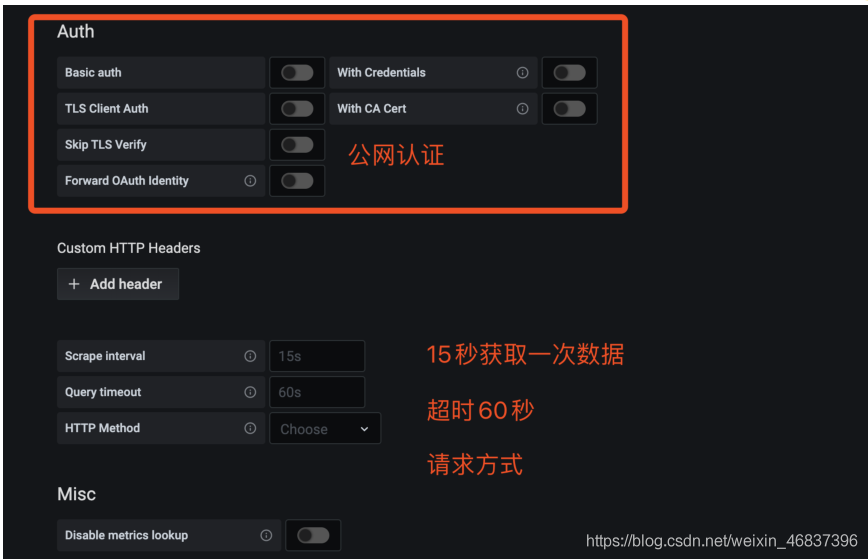
1)添加普羅米修斯服務器

然后為添加好的數據源做圖形顯示
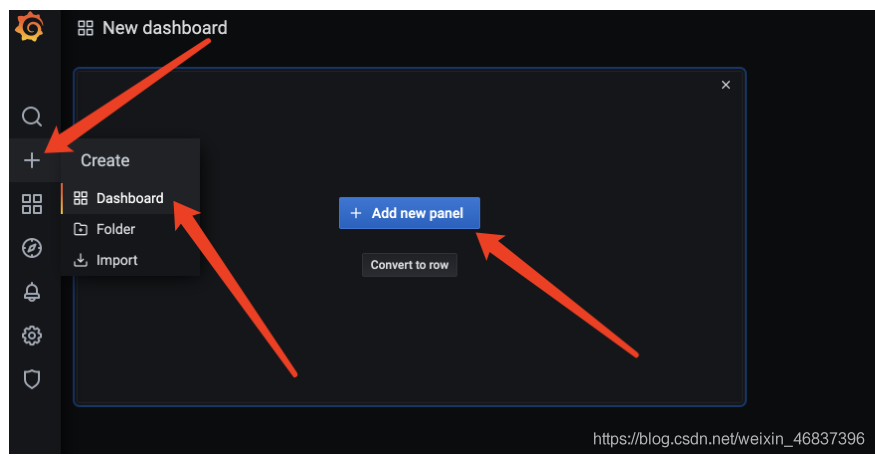

這時候可以自己選擇編譯對應的模板,在prometheus上取值傳到grafana上。就可以了。挺好用的!
6.鍵值查詢通過指標 io_namespace_http_requests_total 我們可以:
查詢應用的請求總量sum(io_namespace_http_requests_total)查詢每秒Http請求量sum(rate(io_wise2c_gateway_requests_total[5m]))查詢當前應用請求量Top N的URItopk(10, sum(io_namespace_http_requests_total) by (path))
配置Prometheus監控Nginx
1、需給Nginx安裝兩個模塊,才可用Prometheus來監控:nginx-module-vts、geoip
2、思路:原來無論是編譯、還是yum裝的nginx,都需要下載同版本的tar包,基于原來安裝選項的基礎上,增加以上兩個模塊選項,進行編譯安裝,來替換原來的nginx,最終將原nginx目錄的配置文件如nginx.conf文件、conf.d目錄再移動到編譯安裝后的nignx目錄內,最后啟動nginx即可。
這里官方源安裝:1)配置官方源
[root@web01 ~]# vim /etc/yum.repos.d/nginx.repo[nginx-stable]name=nginx stable repobaseurl=http://nginx.org/packages/centos/7/$basearch/gpgcheck=1enabled=1gpgkey=https://nginx.org/keys/nginx_signing.keymodule_hotfixes=true
2)安裝依賴
yum install -y gcc gcc-c++ autoconf pcre pcre-devel make automake wget httpd-tools vim tree
3)安裝nginx
[root@web01 ~]# yum install -y nginx
4)配置nginx
[root@web01 ~]# vim /etc/nginx/nginx.confuser www;
5)啟動服務
1.方法一:直接啟動如果有報錯==》重大錯誤,80端口有占用==》查看占用端口的服務HTTPD,停掉,在重啟nginx[root@web01 ~]# systemctl start nginx2.方法二:[root@web01 ~]# nginx
1.查看當前Nginx安裝選項
[root@db01 nginx-1.12.2]# nginx -V[root@db01 nginx-1.12.2]# ./configure --prefix=/usr/share/nginx --sbin-path=/usr/sbin/nginx --modules-path=/usr/lib64/nginx/modules --conf-path=/etc/nginx/nginx.conf --error-log-path=/var/log/nginx/error.log --http-log-path=/var/log/nginx/access.log --http-client-body-temp-path=/var/lib/nginx/tmp/client_body --http-proxy-temp-path=/var/lib/nginx/tmp/proxy --http-fastcgi-temp-path=/var/lib/nginx/tmp/fastcgi --http-uwsgi-temp-path=/var/lib/nginx/tmp/uwsgi --http-scgi-temp-path=/var/lib/nginx/tmp/scgi --pid-path=/run/nginx.pid --lock-path=/run/lock/subsys/nginx --user=nginx --group=nginx --with-compat --with-debug --with-file-aio --with-google_perftools_module --with-http_addition_module --with-http_auth_request_module --with-http_dav_module --with-http_degradation_module --with-http_flv_module --with-http_gunzip_module --with-http_gzip_static_module --with-http_image_filter_module=dynamic --with-http_mp4_module --with-http_perl_module=dynamic --with-http_random_index_module --with-http_realip_module --with-http_secure_link_module --with-http_slice_module --with-http_ssl_module --with-http_stub_status_module --with-http_sub_module --with-http_v2_module --with-http_xslt_module=dynamic --with-mail=dynamic --with-mail_ssl_module --with-pcre --with-pcre-jit --with-stream=dynamic --with-stream_ssl_module --with-stream_ssl_preread_module --with-threads --with-cc-opt=’-O2 -g -pipe -Wall -Wp,-D_FORTIFY_SOURCE=2 -fexceptions -fstack-protector-strong --param=ssp-buffer-size=4 -grecord-gcc-switches -specs=/usr/lib/rpm/redhat/redhat-hardened-cc1 -m64 -mtune=generic’ --with-ld-opt=’-Wl,-z,relro -specs=/usr/lib/rpm/redhat/redhat-hardened-ld -Wl,-E’
2.準備模塊
# 下載、解壓新包[root@k8s-n1 packages]# wget http://nginx.org/download/nginx-1.16.1.tar.gz[root@k8s-n1 packages]# tar xf nginx-1.16.1.tar.gz#克隆下載 nginx-module-vts 模塊[root@k8s-n1 packages]# git clone https://github.com/vozlt/nginx-module-vts# .安裝GeoIP模塊[root@k8s-n1 packages]# yum -y install epel-release geoip-devel
3.停止Nginx服務
# 停止nginx服務[root@k8s-n1 packages]# nginx -s stop# 備份原nginx啟動文件[root@k8s-n1 packages]# which nginx/usr/sbin/nginx[root@k8s-n1 packages]# mv /usr/sbin/nginx /usr/sbin/nginx.bak# 備份原nignx目錄[root@k8s-n1 packages]# mv /etc/nginx nginx-1.12.2.bak
4.編譯安裝
1> 安裝所需依賴
編譯安裝時可能會出現 `make: *** 沒有規則可以創建“default”需要的目標“build”。 停止`的報錯,是因為缺少依賴導致# 管他三七21,裝一波兒在進行編譯,否則裝完依賴還得重新./configure ~yum install -y gcc gcc++ bash-completion vim lrzsz wget expect net-tools nc nmap tree dos2unix htop iftop iotop unzip telnet sl psmisc nethogs glances bc pcre-devel zlib zlib-devel openssl openssl-devel libxml2 libxml2-dev libxslt-devel gd gd-devel perl-devel perl-ExtUtils-Embed GeoIP GeoIP-devel GeoIP-data pcre-devel
2> 編譯安裝
進入剛剛解壓的nginx目錄,編譯安裝 基于原來安裝參數,尾部追加連個參數–add-module=/root/packages/nginx-module-vts–with-http_geoip_module
[root@db01 nginx-1.12.2]# ./configure --prefix=/usr/share/nginx --sbin-path=/usr/sbin/nginx --modules-path=/usr/lib64/nginx/modules --conf-path=/etc/nginx/nginx.conf --error-log-path=/var/log/nginx/error.log --http-log-path=/var/log/nginx/access.log --http-client-body-temp-path=/var/lib/nginx/tmp/client_body --http-proxy-temp-path=/var/lib/nginx/tmp/proxy --http-fastcgi-temp-path=/var/lib/nginx/tmp/fastcgi --http-uwsgi-temp-path=/var/lib/nginx/tmp/uwsgi --http-scgi-temp-path=/var/lib/nginx/tmp/scgi --pid-path=/run/nginx.pid --lock-path=/run/lock/subsys/nginx --user=nginx --group=nginx --with-compat --with-debug --with-file-aio --with-google_perftools_module --with-http_addition_module --with-http_auth_request_module --with-http_dav_module --with-http_degradation_module --with-http_flv_module --with-http_gunzip_module --with-http_gzip_static_module --with-http_image_filter_module=dynamic --with-http_mp4_module --with-http_perl_module=dynamic --with-http_random_index_module --with-http_realip_module --with-http_secure_link_module --with-http_slice_module --with-http_ssl_module --with-http_stub_status_module --with-http_sub_module --with-http_v2_module --with-http_xslt_module=dynamic --with-mail=dynamic --with-mail_ssl_module --with-pcre --with-pcre-jit --with-stream=dynamic --with-stream_ssl_module --with-stream_ssl_preread_module --with-threads --with-cc-opt=’-O2 -g -pipe -Wall -Wp,-D_FORTIFY_SOURCE=2 -fexceptions -fstack-protector-strong --param=ssp-buffer-size=4 -grecord-gcc-switches -specs=/usr/lib/rpm/redhat/redhat-hardened-cc1 -m64 -mtune=generic’ --with-ld-opt=’-Wl,-z,relro -specs=/usr/lib/rpm/redhat/redhat-hardened-ld -Wl,-E’ --add-module=/root/package/nginx-module-vts --with-http_geoip_module
# 編譯安裝# -j 多核編譯(配置低的不建議使用此參數,會卡住~)[root@k8s-n1 nginx-1.12.2]# make -j && make install
5.配置Nginx
[root@k8s-n1 packages]# cp -r nginx-1.12.2.bak/conf.d/ /etc/nginx/[root@k8s-n1 packages]# cp -r nginx-1.12.2.bak/nginx.conf /etc/nginx/[root@k8s-n1 packages]# rm -f /etc/nginx/conf.d/default.conf
配置Nginx配置文件
http層
server層
···http {··· include /etc/nginx/conf.d/*.conf;##################### 1.http層:添加三行配置 ##################### vhost_traffic_status_zone; vhost_traffic_status_filter_by_host on; geoip_country /usr/share/GeoIP/GeoIP.dat;##################### 2.server層:指定server層端口號,建議8088端口,不沖突直接復制粘貼即可##################### server {listen 8088;server_name localhost;# 以下vhost配置寫在此location內location /status {vhost_traffic_status on;# 流量狀態,默認即為on,可不寫此行vhost_traffic_status_display;vhost_traffic_status_display_format html;vhost_traffic_status_filter_by_set_key $uri uri::$server_name; #每個uri訪問量vhost_traffic_status_filter_by_set_key $geoip_country_code country::$server_name; #不同國家/區域請求量vhost_traffic_status_filter_by_set_key $status $server_name; #http code統計vhost_traffic_status_filter_by_set_key $upstream_addr upstream::backend; #后端>轉發統計vhost_traffic_status_filter_by_set_key $remote_port client::ports::$server_name; #請求端口統計vhost_traffic_status_filter_by_set_key $remote_addr client::addr::$server_name; #請求IP統計location ~ ^/storage/(.+)/.*$ { set $volume $1; vhost_traffic_status_filter_by_set_key $volume storage::$server_name; #請求路徑統計}} } ##################### server層:可新建一個server,或在原有的不打緊的配置上修改也可以#####################}
6.啟動Nginx
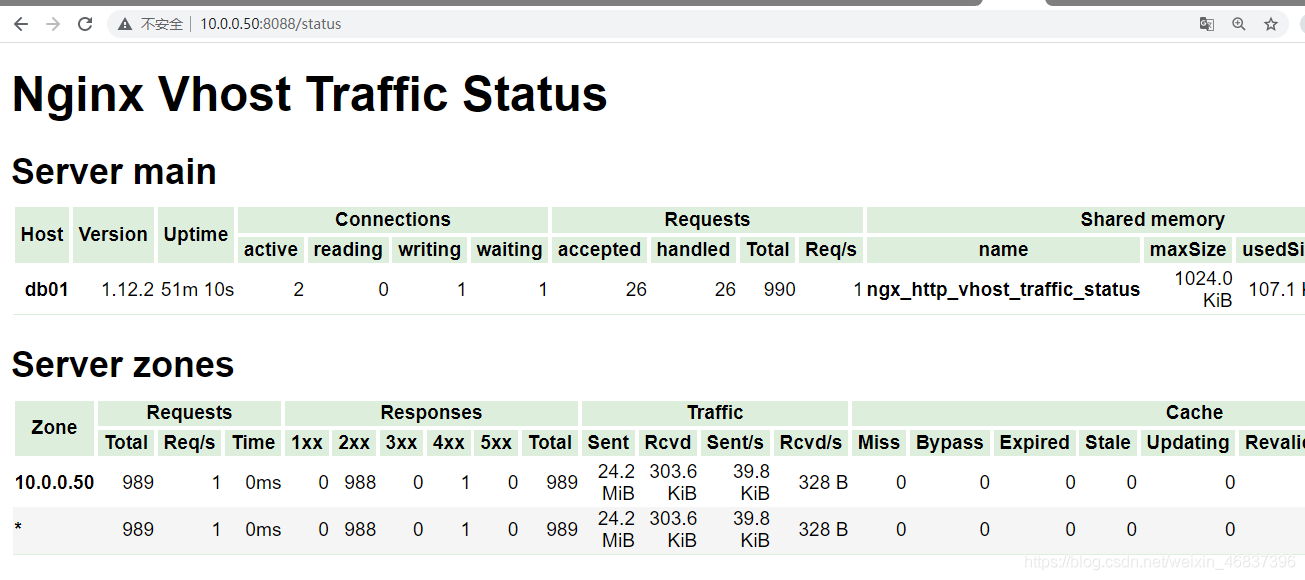
[root@k8s-n1 packages]# nginx[root@k8s-n1 packages]# netstat -lntp|grep nginxtcp0 0 0.0.0.0:80 0.0.0.0:* LISTEN 62214/nginx: master tcp0 0 0.0.0.0:8088 0.0.0.0:* LISTEN 62214/nginx: master 瀏覽器訪問:172.23.0.243:80# nginx 默認官方頁面172.23.0.243:8088/status # nignx 監控項頁面
[root@k8s-m1 ~]# vim prometheus.yml···scrape_configs: - job_name: 'Nginx' metrics_path: ’/status/format/prometheus’ static_configs: - targets: [’172.23.0.243:8088’]···[root@k8s-m1 ~]# docker restart prometheus# 此時進入prometheus管理頁面,則能查詢nginx的監控項8.各個監控項的含義
Nginx-module-vts提供了多種監控項,了解監控項含義,有助于幫助自己生成需要的圖表
# HELP nginx_vts_info Nginx info# TYPE nginx_vts_info gaugenginx_vts_info{hostname='hbhly_21_205',version='1.16.1'} 1# HELP nginx_vts_start_time_seconds Nginx start time# TYPE nginx_vts_start_time_seconds gaugenginx_vts_start_time_seconds 1584268136.439# HELP nginx_vts_main_connections Nginx connections# TYPE nginx_vts_main_connections gauge# 區分狀態的nginx連接數nginx_vts_main_connections{status='accepted'} 9271nginx_vts_main_connections{status='active'} 7nginx_vts_main_connections{status='handled'} 9271nginx_vts_main_connections{status='reading'} 0nginx_vts_main_connections{status='requests'} 438850nginx_vts_main_connections{status='waiting'} 6nginx_vts_main_connections{status='writing'} 1# HELP nginx_vts_main_shm_usage_bytes Shared memory [ngx_http_vhost_traffic_status] info# TYPE nginx_vts_main_shm_usage_bytes gauge# 內存使用量nginx_vts_main_shm_usage_bytes{shared='max_size'} 1048575nginx_vts_main_shm_usage_bytes{shared='used_size'} 24689nginx_vts_main_shm_usage_bytes{shared='used_node'} 7# HELP nginx_vts_server_bytes_total The request/response bytes# TYPE nginx_vts_server_bytes_total counter# HELP nginx_vts_server_requests_total The requests counter# TYPE nginx_vts_server_requests_total counter# HELP nginx_vts_server_request_seconds_total The request processing time in seconds# TYPE nginx_vts_server_request_seconds_total counter# HELP nginx_vts_server_request_seconds The average of request processing times in seconds# TYPE nginx_vts_server_request_seconds gauge# HELP nginx_vts_server_request_duration_seconds The histogram of request processing time# TYPE nginx_vts_server_request_duration_seconds histogram# HELP nginx_vts_server_cache_total The requests cache counter# TYPE nginx_vts_server_cache_total counter# 分Host的進出流量nginx_vts_server_bytes_total{host='10.160.21.205',direction='in'} 22921464nginx_vts_server_bytes_total{host='10.160.21.205',direction='out'} 1098196005# 分狀態碼的請求數量統計 1** 2** 3** 4** 5**nginx_vts_server_requests_total{host='10.160.21.205',code='1xx'} 0nginx_vts_server_requests_total{host='10.160.21.205',code='2xx'} 86809nginx_vts_server_requests_total{host='10.160.21.205',code='3xx'} 0nginx_vts_server_requests_total{host='10.160.21.205',code='4xx'} 2nginx_vts_server_requests_total{host='10.160.21.205',code='5xx'} 0nginx_vts_server_requests_total{host='10.160.21.205',code='total'} 86811# 響應時間nginx_vts_server_request_seconds_total{host='10.160.21.205'} 0.000nginx_vts_server_request_seconds{host='10.160.21.205'} 0.000# 分狀態的緩存的統計nginx_vts_server_cache_total{host='10.160.21.205',status='miss'} 0nginx_vts_server_cache_total{host='10.160.21.205',status='bypass'} 0nginx_vts_server_cache_total{host='10.160.21.205',status='expired'} 0nginx_vts_server_cache_total{host='10.160.21.205',status='stale'} 0nginx_vts_server_cache_total{host='10.160.21.205',status='updating'} 0nginx_vts_server_cache_total{host='10.160.21.205',status='revalidated'} 0nginx_vts_server_cache_total{host='10.160.21.205',status='hit'} 0nginx_vts_server_cache_total{host='10.160.21.205',status='scarce'} 0nginx_vts_server_bytes_total{host='devapi.feedback.test',direction='in'} 3044526nginx_vts_server_bytes_total{host='devapi.feedback.test',direction='out'} 41257028# 分狀態的連接數的統計nginx_vts_server_requests_total{host='devapi.feedback.test',code='1xx'} 0nginx_vts_server_requests_total{host='devapi.feedback.test',code='2xx'} 3983nginx_vts_server_requests_total{host='devapi.feedback.test',code='3xx'} 0nginx_vts_server_requests_total{host='devapi.feedback.test',code='4xx'} 24nginx_vts_server_requests_total{host='devapi.feedback.test',code='5xx'} 11nginx_vts_server_requests_total{host='devapi.feedback.test',code='total'} 4018nginx_vts_server_request_seconds_total{host='devapi.feedback.test'} 327.173nginx_vts_server_request_seconds{host='devapi.feedback.test'} 0.000# nginx緩存計算器,精確到狀態和typenginx_vts_server_cache_total{host='devapi.feedback.test',status='miss'} 0nginx_vts_server_cache_total{host='devapi.feedback.test',status='bypass'} 0nginx_vts_server_cache_total{host='devapi.feedback.test',status='expired'} 0nginx_vts_server_cache_total{host='devapi.feedback.test',status='stale'} 0nginx_vts_server_cache_total{host='devapi.feedback.test',status='updating'} 0nginx_vts_server_cache_total{host='devapi.feedback.test',status='revalidated'} 0nginx_vts_server_cache_total{host='devapi.feedback.test',status='hit'} 0nginx_vts_server_cache_total{host='devapi.feedback.test',status='scarce'} 0nginx_vts_server_bytes_total{host='testapi.feedback.test',direction='in'} 55553573nginx_vts_server_bytes_total{host='testapi.feedback.test',direction='out'} 9667561188nginx_vts_server_requests_total{host='testapi.feedback.test',code='1xx'} 0nginx_vts_server_requests_total{host='testapi.feedback.test',code='2xx'} 347949nginx_vts_server_requests_total{host='testapi.feedback.test',code='3xx'} 31nginx_vts_server_requests_total{host='testapi.feedback.test',code='4xx'} 7nginx_vts_server_requests_total{host='testapi.feedback.test',code='5xx'} 33nginx_vts_server_requests_total{host='testapi.feedback.test',code='total'} 348020nginx_vts_server_request_seconds_total{host='testapi.feedback.test'} 2185.177nginx_vts_server_request_seconds{host='testapi.feedback.test'} 0.001nginx_vts_server_cache_total{host='testapi.feedback.test',status='miss'} 0nginx_vts_server_cache_total{host='testapi.feedback.test',status='bypass'} 0nginx_vts_server_cache_total{host='testapi.feedback.test',status='expired'} 0nginx_vts_server_cache_total{host='testapi.feedback.test',status='stale'} 0nginx_vts_server_cache_total{host='testapi.feedback.test',status='updating'} 0nginx_vts_server_cache_total{host='testapi.feedback.test',status='revalidated'} 0nginx_vts_server_cache_total{host='testapi.feedback.test',status='hit'} 0nginx_vts_server_cache_total{host='testapi.feedback.test',status='scarce'} 0nginx_vts_server_bytes_total{host='*',direction='in'} 81519563nginx_vts_server_bytes_total{host='*',direction='out'} 10807014221# 分host請求數量統計nginx_vts_server_requests_total{host='*',code='1xx'} 0nginx_vts_server_requests_total{host='*',code='2xx'} 438741nginx_vts_server_requests_total{host='*',code='3xx'} 31nginx_vts_server_requests_total{host='*',code='4xx'} 33nginx_vts_server_requests_total{host='*',code='5xx'} 44nginx_vts_server_requests_total{host='*',code='total'} 438849nginx_vts_server_request_seconds_total{host='*'} 2512.350nginx_vts_server_request_seconds{host='*'} 0.007# 分host緩存統計nginx_vts_server_cache_total{host='*',status='miss'} 0nginx_vts_server_cache_total{host='*',status='bypass'} 0nginx_vts_server_cache_total{host='*',status='expired'} 0nginx_vts_server_cache_total{host='*',status='stale'} 0nginx_vts_server_cache_total{host='*',status='updating'} 0nginx_vts_server_cache_total{host='*',status='revalidated'} 0nginx_vts_server_cache_total{host='*',status='hit'} 0nginx_vts_server_cache_total{host='*',status='scarce'} 0# HELP nginx_vts_upstream_bytes_total The request/response bytes# TYPE nginx_vts_upstream_bytes_total counter# HELP nginx_vts_upstream_requests_total The upstream requests counter# TYPE nginx_vts_upstream_requests_total counter# HELP nginx_vts_upstream_request_seconds_total The request Processing time including upstream in seconds# TYPE nginx_vts_upstream_request_seconds_total counter# HELP nginx_vts_upstream_request_seconds The average of request processing times including upstream in seconds# TYPE nginx_vts_upstream_request_seconds gauge# HELP nginx_vts_upstream_response_seconds_total The only upstream response processing time in seconds# TYPE nginx_vts_upstream_response_seconds_total counter# HELP nginx_vts_upstream_response_seconds The average of only upstream response processing times in seconds# TYPE nginx_vts_upstream_response_seconds gauge# HELP nginx_vts_upstream_request_duration_seconds The histogram of request processing time including upstream# TYPE nginx_vts_upstream_request_duration_seconds histogram# HELP nginx_vts_upstream_response_duration_seconds The histogram of only upstream response processing time# TYPE nginx_vts_upstream_response_duration_seconds histogram# 分upstream流量統計nginx_vts_upstream_bytes_total{upstream='::nogroups',backend='10.144.227.162:80',direction='in'} 12296nginx_vts_upstream_bytes_total{upstream='::nogroups',backend='10.144.227.162:80',direction='out'} 13582924nginx_vts_upstream_requests_total{upstream='::nogroups',backend='10.144.227.162:80',code='1xx'} 0nginx_vts_upstream_requests_total{upstream='::nogroups',backend='10.144.227.162:80',code='2xx'} 25nginx_vts_upstream_requests_total{upstream='::nogroups',backend='10.144.227.162:80',code='3xx'} 0nginx_vts_upstream_requests_total{upstream='::nogroups',backend='10.144.227.162:80',code='4xx'} 0nginx_vts_upstream_requests_total{upstream='::nogroups',backend='10.144.227.162:80',code='5xx'} 0nginx_vts_upstream_requests_total{upstream='::nogroups',backend='10.144.227.162:80',code='total'} 25nginx_vts_upstream_request_seconds_total{upstream='::nogroups',backend='10.144.227.162:80'} 1.483nginx_vts_upstream_request_seconds{upstream='::nogroups',backend='10.144.227.162:80'} 0.000nginx_vts_upstream_response_seconds_total{upstream='::nogroups',backend='10.144.227.162:80'} 1.484nginx_vts_upstream_response_seconds{upstream='::nogroups',backend='10.144.227.162:80'} 0.000nginx_vts_upstream_bytes_total{upstream='::nogroups',backend='10.152.218.149:80',direction='in'} 12471nginx_vts_upstream_bytes_total{upstream='::nogroups',backend='10.152.218.149:80',direction='out'} 11790508nginx_vts_upstream_requests_total{upstream='::nogroups',backend='10.152.218.149:80',code='1xx'} 0nginx_vts_upstream_requests_total{upstream='::nogroups',backend='10.152.218.149:80',code='2xx'} 24nginx_vts_upstream_requests_total{upstream='::nogroups',backend='10.152.218.149:80',code='3xx'} 0nginx_vts_upstream_requests_total{upstream='::nogroups',backend='10.152.218.149:80',code='4xx'} 0nginx_vts_upstream_requests_total{upstream='::nogroups',backend='10.152.218.149:80',code='5xx'} 0nginx_vts_upstream_requests_total{upstream='::nogroups',backend='10.152.218.149:80',code='total'} 24nginx_vts_upstream_request_seconds_total{upstream='::nogroups',backend='10.152.218.149:80'} 1.169nginx_vts_upstream_request_seconds{upstream='::nogroups',backend='10.152.218.149:80'} 0.000nginx_vts_upstream_response_seconds_total{upstream='::nogroups',backend='10.152.218.149:80'} 1.168nginx_vts_upstream_response_seconds{upstream='::nogroups',backend='10.152.218.149:80'} 0.000nginx_vts_upstream_bytes_total{upstream='::nogroups',backend='10.160.21.205:8081',direction='in'} 3036924nginx_vts_upstream_bytes_total{upstream='::nogroups',backend='10.160.21.205:8081',direction='out'} 33355357nginx_vts_upstream_requests_total{upstream='::nogroups',backend='10.160.21.205:8081',code='1xx'} 0nginx_vts_upstream_requests_total{upstream='::nogroups',backend='10.160.21.205:8081',code='2xx'} 3971nginx_vts_upstream_requests_total{upstream='::nogroups',backend='10.160.21.205:8081',code='3xx'} 0nginx_vts_upstream_requests_total{upstream='::nogroups',backend='10.160.21.205:8081',code='4xx'} 24nginx_vts_upstream_requests_total{upstream='::nogroups',backend='10.160.21.205:8081',code='5xx'} 11nginx_vts_upstream_requests_total{upstream='::nogroups',backend='10.160.21.205:8081',code='total'} 4006nginx_vts_upstream_request_seconds_total{upstream='::nogroups',backend='10.160.21.205:8081'} 326.427nginx_vts_upstream_request_seconds{upstream='::nogroups',backend='10.160.21.205:8081'} 0.000nginx_vts_upstream_response_seconds_total{upstream='::nogroups',backend='10.160.21.205:8081'} 300.722nginx_vts_upstream_response_seconds{upstream='::nogroups',backend='10.160.21.205:8081'} 0.000nginx_vts_upstream_bytes_total{upstream='::nogroups',backend='10.160.21.205:8082',direction='in'} 55536408nginx_vts_upstream_bytes_total{upstream='::nogroups',backend='10.160.21.205:8082',direction='out'} 9650089427nginx_vts_upstream_requests_total{upstream='::nogroups',backend='10.160.21.205:8082',code='1xx'} 0nginx_vts_upstream_requests_total{upstream='::nogroups',backend='10.160.21.205:8082',code='2xx'} 347912nginx_vts_upstream_requests_total{upstream='::nogroups',backend='10.160.21.205:8082',code='3xx'} 31nginx_vts_upstream_requests_total{upstream='::nogroups',backend='10.160.21.205:8082',code='4xx'} 7nginx_vts_upstream_requests_total{upstream='::nogroups',backend='10.160.21.205:8082',code='5xx'} 33nginx_vts_upstream_requests_total{upstream='::nogroups',backend='10.160.21.205:8082',code='total'} 347983nginx_vts_upstream_request_seconds_total{upstream='::nogroups',backend='10.160.21.205:8082'} 2183.271nginx_vts_upstream_request_seconds{upstream='::nogroups',backend='10.160.21.205:8082'} 0.001nginx_vts_upstream_response_seconds_total{upstream='::nogroups',backend='10.160.21.205:8082'} 2180.893nginx_vts_upstream_response_seconds{upstream='::nogroups',backend='10.160.21.205:8082'} 0.0019.Prometheus UI中Target表達式查詢
1)CAdvisor中獲取的典型監控指標
指標名稱 類型 含義 container_cpu_load_average_10s gauge 過去10秒內容器CPU的平均負載 container_cpu_usage_seconds_total counter 容器在每個CPU內核上的累積占用時間 (單位:秒) container_cpu_system_seconds_total counter System CPU累積占用時間(單位:秒) container_cpu_user_seconds_total counter User CPU累積占用時間(單位:秒) container_fs_usge_bytes gauge 容器中文件系統的使用量(單位:字節) container_network_receive_bytes_total counter 容器網絡累計接受數據總量(單位: 字節) container_network_transmit_bytes_total counter 容器網絡累計傳輸數據總量(單位: 字節)2)容器相關
# 容器的CPU使用率sum(irate(container_cpu_usage_seconds_total{image!=''}[1m])) without (cpu)# 容器內存使用量(單位: 字節)container_memory_usage_bytes{image!=''}# 容器網絡接收量速率(單位: 字節/秒)sum(rate(container_network_receive_bytes_total{image!=''}[1m])) without (interface)# 容器網絡傳輸量速率sum(rate(container_network_transmit_bytes_total{image!=''}[1m])) without (interface)# 容器文件系統讀取速率sum(rate(container_fs_reads_bytes_total{image!=''}[1m])) without (device)# 容器文件系統寫入速率(單位: 字節/秒)sum(rate(container_fs_writes_bytes_total{image!=''}[1m])) without (device)
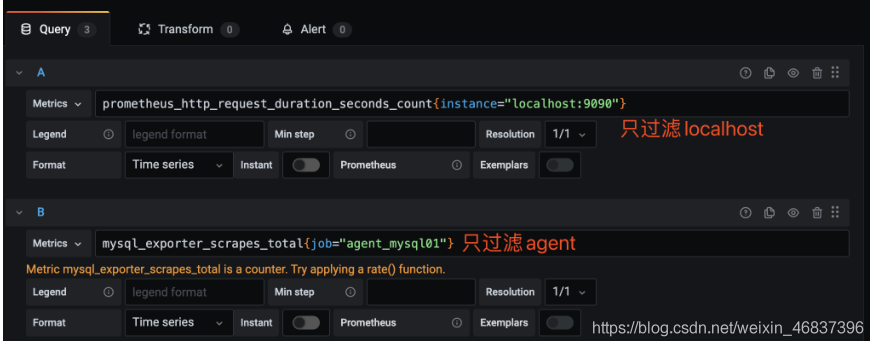
3)http相關
# HTTP請求總數prometheus_http_requests_total# HTTP請求持續時間秒桶prometheus_http_request_duration_seconds_bucket# HTTP請求持續時間秒數計數prometheus_http_request_duration_seconds_count# HTTP請求持續時間秒數之和prometheus_http_request_duration_seconds_sum# HTTP響應大小字節prometheus_http_response_size_bytes_bucket# HTTP響應大小字節計數計數prometheus_http_response_size_bytes_count# HTTP響應大小字節的總和prometheus_http_response_size_bytes_sum
4)Nginx相關
# Nginxvts過濾字節總數nginx_vts_filter_bytes_total# Nginx VTS過濾器緩存總數nginx_vts_filter_cache_total# Nginx VTS過濾請求秒數nginx_vts_filter_request_seconds# Nginx VTS過濾器請求總秒數nginx_vts_filter_request_seconds_total# Nginx VTS過濾器請求總數nginx_vts_filter_requests_total# nginx信息nginx_vts_info# Nginx VTS主連接nginx_vts_main_connections# Nginx VTS主SHM使用字節nginx_vts_main_shm_usage_bytes# Nginx VTS服務器字節總數nginx_vts_server_bytes_total# Nginx VTS服務器緩存總數nginx_vts_server_cache_total# Nginx_vts服務器請求秒nginx_vts_server_request_seconds# Nginx_vts服務器請求總秒數nginx_vts_server_request_seconds_total# Nginx_vts服務總請求數nginx_vts_server_requests_total# Nginx VTS開始時間秒數nginx_vts_start_time_seconds10.安裝blackbox_exporter blackbox收集服務狀態信息,如判斷服務http請求是否返回200繼而報警 blackbox_exporter是Prometheus 官方提供的 exporter 之一,可以提供 http、dns、tcp、icmp 的監控數據采集
功能:HTTP 測試 定義 Request Header 信息 判斷 Http status / Http Respones Header / Http Body 內容 TCP 測試 業務組件端口狀態監聽 應用層協議定義與監聽 ICMP 測試主機探活機制POST 測試接口聯通性SSL 證書過期時間# 下載、解壓[root@11 Prometheus]# wget https://github.com/prometheus/blackbox_exporter/releases/download/v0.14.0/blackbox_exporter-0.14.0.linux-amd64.tar.gz[root@11 Prometheus]# tar -xvf blackbox_exporter-0.14.0.linux-amd64.tar.gz[root@11 Prometheus]# mv blackbox_exporter-0.14.0.linux-amd64 /usr/local/blackbox_exporter# 查看安裝是否成功[root@11 Prometheus]# /usr/local/blackbox_exporter/blackbox_exporter --versionblackbox_exporter, version 0.14.0 (branch: HEAD, revision: bba7ef76193948a333a5868a1ab38b864f7d968a) build user: root@63d11aa5b6c6 build date: 20190315-13:32:31 go version: go1.11.5# 加入systemd管理[root@11 Prometheus]# cat /usr//lib/systemd/system/blackbox_exporter.service[Unit]Description=blackbox_exporter [Service]User=rootType=simpleExecStart=/usr/local/blackbox_exporter/blackbox_exporter --config.file=/usr/local/blackbox_exporter/blackbox.ymlRestart=on-failure[root@11 Prometheus]# # 啟動[root@11 Prometheus]# systemctl daemon-reload[root@11 Prometheus]# systemctl enable --now blackbox_exporter11.Docker部署nginx-module-vts模塊
由于yum安裝的nginx,默認是沒有nginx-module-vts模塊的,需要下載對應的nginx源碼,進行重新編譯才行。
Docker 搭建 Consul集群(未完)1.啟動第一個consul服務:consul1
docker run --name consul1 -d -p 8500:8500 -p 8300:8300 -p 8301:8301 -p 8302:8302 -p 8600:8600 --restart=always consul:latest agent -server -bootstrap-expect 2 -ui -bind=0.0.0.0 -client=0.0.0.0# 獲取 consul server1 的 ip 地址docker inspect --format ’{{ .NetworkSettings.IPAddress }}’ consul1172.17.0.2# PS: 8500 http 端口,用于 http 接口和 web ui 8300 server rpc 端口,同一數據中心 consul server 之間通過該端口通信 8301 serf lan 端口,同一數據中心 consul client 通過該端口通信 8302 serf wan 端口,不同數據中心 consul server 通過該端口通信 8600 dns 端口,用于服務發現 -bbostrap-expect 2: 集群至少兩臺服務器,才能選舉集群leader -ui:運行 web 控制臺 -bind: 監聽網口,0.0.0.0 表示所有網口,如果不指定默認為127.0.0.1,則無法和容器通信 -client : 限制某些網口可以訪問
2.啟動第二個consul服務:consul2, 并加入consul1(使用join命令)
docker run -d --name consul2 -d -p 8501:8500 consul agent -server -ui -bind=0.0.0.0 -client=0.0.0.0 -join 172.17.0.2docker run -d -p 8501:8500 --restart=always -v /XiLife/consul/data/server3:/consul/data -v /XiLife/consul/conf/server2:/consul/config -e CONSUL_BIND_INTERFACE=’eth0’ --privileged=true --name=consu2 consul agent -server -ui -node=consul2 -client=’0.0.0.0’ -datacenter=xdp_dc -data-dir /consul/data -config-dir /consul/config -join=172.17.0.2
3.啟動第三個consul服務:consul3,并加入consul1
docker run --name consul3 -d -p 8502:8500 consul agent -server -ui -bind=0.0.0.0 -client=0.0.0.0 -join 172.17.0.2
4.查看運行的容器(consul集群狀態)
[root@k8s-m1 consul]# docker exec -it consul1 consul membersNode Address Status Type Build Protocol DC Segment013a4a7e74d2 172.17.0.4:8301 alive server 1.10.0 2 dc1 <all>3c118fa83d47 172.17.0.3:8301 alive server 1.10.0 2 dc1 <all>4b5123c97c2b 172.17.0.5:8301 alive server 1.10.0 2 dc1 <all>a7d272ad157a 172.17.0.2:8301 alive server 1.10.0 2 dc1 <all>
5.服務注冊與剔除
接下來,我們要注冊服務到 Consul 中,可以通過其提供的 API 標準接口來添加 那么先注冊一個測試服務,該測試數據為本機 node-exporter 服務信息,服務地址及端口為 node-exporter 默認提供指標數據的地址,執行如下命令# 注冊241的 node-exporter 服務信息curl -X PUT -d ’{'id': 'node-exporter','name': 'node-exporter-172.23.0.241','address': '172.23.0.241','port': 9100,'tags': ['prometheus'],'checks': [{'http': 'http://172.23.0.241:9100/metrics', 'interval': '5s'}]}’ http://172.23.0.241:8500/v1/agent/service/register# 注冊242的 node-exporter 服務信息將上面所有IP地址改為242的即可,端口不變
如果要注銷掉某個服務,可以通過如下 API 命令操作,例如注銷上邊添加的 node-exporter 服務
curl -X PUT http://172.23.0.241:8500/v1/agent/service/deregister/node-exporter
附:升級Centos6內核
rpm -Uvh https://hkg.mirror.rackspace.com/elrepo/kernel/el6/x86_64/RPMS/elrepo-release-6-12.el6.elrepo.noarch.rpmyum源報錯解決:找不到鏡像源cd /etc/yum.repos.dmv CentOS-Base.repo CentOS-Base.repo.backupwget http://mirrors.163.com/.help/CentOS6-Base-163.repomv CentOS6-Base-163.repo CentOS-Base.repoyum clean allwget -O /etc/yum.repos.d/CentOS-Base.repo http://file.kangle.odata.cc/repo/Centos-6.repowget -O /etc/yum.repos.d/epel.repo http://file.kangle.odata.cc/repo/epel-6.repoyum makecache
到此這篇關于Docker 部署 Prometheus的文章就介紹到這了,更多相關Docker 部署 Prometheus內容請搜索好吧啦網以前的文章或繼續瀏覽下面的相關文章希望大家以后多多支持好吧啦網!
相關文章:

 網公網安備
網公網安備